
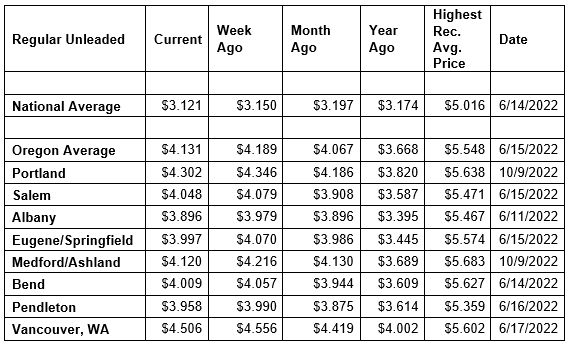
Pump prices continue to ease in Oregon and most states. Cheaper winter-blend gas and relatively low crude oil prices are putting downward pressure on pump prices. However, drivers here on the West Coast may see prices rise again after last week’s refinery fire in Southern California. For the week, the national average for regular declines three cents to $3.12 a gallon. The Oregon average loses six cents to $4.13 a gallon.
A huge fire broke out at the El Segundo Chevron refinery last Thursday evening. This facility is one of the largest in California, producing about 40% of Southern California’s jet fuel as well as about 20% of its fuel for cars.
“Having a major refinery like this offline can cause gas prices to rise due to reduced supplies,” says Marie Dodds, public affairs director for AAA Oregon/Idaho. “The refinery fire comes about a month after the Olympic Pipeline was out of operation. These types of outages can have a tremendous impact on retail gas prices in the West Coast region.”
The fire was contained to one processing unit and no injuries were reported. The full impact of the fire is still being assessed and there’s no estimate on when the refinery might reopen.
Another factor that could impact gas prices this season is a major storm. This year’s Atlantic hurricane season has been less active than some years, but the season continues through November 30. Any storm that targets the Gulf Coast can have an impact on the production and distribution of oil and gas.
The Oregon average for regular gas began 2025 at $3.45 a gallon and is currently at $4.13. The highest price of the year so far is $4.297 on September 13 and 14. The lowest price of the year so far is just under $3.45 a gallon on January 2.
The national average began 2025 at $3.06 a gallon and is currently at $3.12. The highest price of the year so far is $3.268 on April 4. The lowest price of the year so far is $3.06 on January 5.
This week 26 Oregon counties have averages at or above $4, compared to 28 a week ago:
Clackamas $4.27
Clatsop $4.14
Columbia $4.24
Coos $4.13
Crook $4.09
Curry $4.25
Douglas $4.07
Grant $4.36
Harney $4.38
Hood River $4.03
Jackson $4.12
Jefferson $4.
Josephine $4.19
Klamath $4.04
Lake $4.26
Lane $4.00
Marion $4.04
Morrow $4.02
Multnomah $4.34
Polk $4.01
Sherman $4.08
Tillamook $4.24
Wallowa $4.20
Wasco $4.14
Washington $4.32
Yamhill $4.20
Demand for gasoline in the U.S. decreased from 8.96 million b/d last week to 8.52 million for the week ending September 26. This compares to 8.52 million b/d a year ago. Total domestic gasoline supply increased from 216.6 million barrels to 220.7 million. Gasoline production decreased last week, averaging 9.3 million barrels per day compared to 9.7 million barrels per day the previous week.
Gas prices usually drop in the fall, due to the switch from summer-blend to winter-blend fuel, which costs less to produce. The switch starts in September. Many areas, including Oregon, can sell winter-blend fuel starting September 15. However, Northern and Southern California require summer-blend fuel through October 31. Prices usually decline to their lowest levels of the year in late fall and early winter before increasing again in the late winter and early spring.
Gas prices typically rise starting in mid-to-late winter and early spring as refineries undergo maintenance ahead of the switch to summer-blend fuel, which is more expensive to produce and less likely to evaporate in warmer temperatures. The switch occurs first in California, which is why pump prices on the West Coast often rise before other parts of the country. The East Coast is the last major market to switch to summer-blend fuel. Most areas have a May 1 compliance date for refiners and terminals, while most gas stations have a June 1 deadline to switch to selling summer-blend until June 1. Switch-over dates are earlier in California with some areas in the state requiring summer-blend fuel by April 1. Some refineries will begin maintenance and the switchover in February.
The U.S. price of crude oil (West Texas Intermediate) had been mostly in the low-$60s to mid-$70s since September 2024. Crude prices spiked to the mid-$70s in mid-June in response to the strikes between Israel and Iran, and then the U.S. strike on Iran’s nuclear facilities, but then prices fell back into the $60s on the belief that the conflict would not have a major impact on global oil supplies. Crude prices fell in early April as markets reacted to President Trumps tariffs and the impact on U.S. and global markets. Additional downward pressure on crude prices came after the decision by OPEC+ to increase production. The lowest closing price since September was $57.13 on May 5, which was the lowest closing price since February 2021. The recent high price for crude was $80.04 per barrel on January 15, which was the highest price since last August.
Crude oil is trading around $61 today compared to $62 a week ago and $77 a year ago. In 2024, West Texas Intermediate ranged between $66 and $87 per barrel. In 2023, WTI ranged between $63 and $95 per barrel. WTI reached recent highs of $123.70 on March 8, 2022, shortly after the Russian invasion of Ukraine, and $122.11 per barrel on June 8, 2022. The all-time high for WTI crude oil is $147.27 in July 2008.
Crude prices are impacted by economic news as well as geopolitical events around the world including the current economic uncertainty, unrest in the Middle East, the war between Israel and Hamas, and the war between Russia and Ukraine. Russia is a top global oil producer, behind the U.S. and Saudi Arabia. Crude prices have been volatile after the attack on Israel by Hamas in October 2023. While Israel and the Palestinian territory are not oil producers, concerns remain that the conflict could spread in the Middle East, which could potentially impact crude production in other oil-producing nations in the region. In addition, production cuts by OPEC+ in previous years tightened global crude oil supplies, which continued to impact prices. But this year, the cartel boosted production by 411,000 barrels per day in May and June, and July, 548,000 barrels per day in August, 547,000 barrels per day in September, and 137,000 barrels per day in October.
Crude oil is the main ingredient in gasoline and diesel, so pump prices are impacted by crude prices on the global markets. On average, about 51% of what we pay for in a gallon of gasoline is for the price of crude oil, 18% is refining, 16% distribution and marketing, and 16% are taxes, according to the U.S. Energy Information Administration.
Meanwhile, crude oil production in the U.S. remains near record highs. The U.S. Energy Information Administration (EIA) reports that crude production in his country is holding steady at 13.50 million barrels per day for the week ending September 26. The record high is 13.63 million barrels per day for the week of December 6. Production has been at 13.5 million barrels per day many times since October 2024. The U.S. has been the top producer of crude oil in the world since 2018 and has been increasing its oil production since about 2009.
Quick stats
Oregon is one of 42 states and the District of Columbia with lower prices now than a week ago. Delaware (-12 cents) has the largest week-over-week decline in the nation. Oregon (-6 cents) has the ninth-largest decrease. Texas (+1 cent) has the biggest week-over-week increase in the nation.
California ($4.65) is the state with the most expensive gas in the nation for the third week in a row. Washington took over the top spot for a week in September when the Olympic Pipeline was out of operation. This week, Washington ($4.51) is second, Hawaii ($4.48) is third, and Oregon ($4.13) is fourth. These are the four states with averages at or above $4 a gallon. This week 18 states and the District of Columbia have averages in the $3-range. There are 28 states with an average in the $2 range this week.
The cheapest gas in the nation is in Oklahoma ($2.59) and Mississippi ($2.68) and. No state has had an average below $2 a gallon since January 7, 2021, when Mississippi and Texas were below that threshold. At the time, the COVID-19 pandemic drove significant declines in crude oil and gasoline demand in the U.S. and around the world.
The difference between the most expensive and least expensive states is $2.07 this week, compared to $2.02 a week ago.
Oregon is one of nine states with higher prices now than a month ago. The national average is eight cents less and the Oregon average is six cents more than a month ago. This is the third largest month-over-month jump for a state in the nation. Utah (+10 cents) has the largest month-over-month increase in the nation, while Alaska (+7 cents) has the second largest monthly increase. Colorado (-27 cents) has the largest month-over-month drop.
Oregon is one of 11 states with higher prices now than a year ago. The national average is five cents less, while the Oregon average is 46 cents more. Oregon has the second largest year-over-year increase in the nation. Washington (+48 cents) has the largest increase. Colorado (-40 cents) has the largest yearly drop.
West Coast
The West Coast region continues to have the most expensive pump prices in the nation with all seven states in the top 10. It’s typical for the West Coast to have six or seven states in the top 10 as this region tends to consistently have fairly tight supplies, consuming about as much gasoline as is produced. In addition, this region is located relatively far from parts of the country where oil drilling, production and refining occurs, so transportation costs are higher. And environmental programs in this region add to the cost of production, storage and distribution.
Last week’s refinery fire at the Chevon El Segundo refinery in Southern California could cause prices in the region to rise, depending on how long the facility is out of operation.
| Rank | Region | Price on 10/7/2025 |
| 1 | California | $4.66 |
| 2 | Washington | $4.51 |
| 3 | Hawaii | $4.48 |
| 4 | Oregon | $4.13 |
| 5 | Nevada | $3.91 |
| 6 | Alaska | $3.85 |
| 7 | Arizona | $3.52 |
| 8 | Idaho | $3.48 |
| 9 | Utah | $3.39 |
| 10 | Illinois | $3.29 |
As mentioned above, California is the state with the most expensive gas in the nation for the third week in a row. Washington is second – it held the top spot for one week in September due to the outage of the Olympic Pipeline. Hawaii, Oregon, Nevada, Alaska, and Arizona round out the top seven. Oregon is fourth most expensive for the 20th week in a row.
Four of the seven West Coast states have week-over-week decreases: Oregon (-6 cents), Washington (-4 cents), Arizona (-3 cents), and Alaska (-2 cents). California (+1 cent), Hawaii (+1/2 cent) and Nevada (+4/10ths of a cent) have small increases.
The refinery utilization rate on the West Coast rose from 87.9 to 88.5% for the week ending September 26. This rate has ranged between about 72% to 93% in the last year. The latest national refinery utilization rate fell from 93.0% to 91.4%.
The refinery utilization rate measures how much crude oil refineries are processing as a percentage of their maximum capacity. A low or declining rate can put upward pressure on pump prices, while a high or rising rate can put downward pressure on pump prices.
According to EIA’s latest weekly report, total gas stocks in the region increased from 30.05 million bbl. to 30.29 million bbl. An increase in gasoline stocks can put downward pressure on pump prices, while a decrease in gasoline stocks can put upward pressure on pump prices.